The Overnight ETF Flow Lab: 20 Days, 49 Funds, $55B
Forty-nine exchange-traded funds moved fifty-five and a half billion dollars on the overnight ATS tape in the last twenty trading days. Eleven of them, all leveraged, accounted for almost half of it. The flow lab is what happens when you let an unsupervised model look at that footprint and group the funds by behavior rather than by the issuer's prospectus.
The standard way to talk about ETFs is to talk about what they hold. The flow lab ignores that. It asks a different question: across the last twenty nights, what does each fund's overnight ATS footprint actually look like, and which other funds share that footprint? The answer turns out to be more useful than the prospectus taxonomy because it surfaces the funds that behave like leverage instruments even when they don't carry the label, and it isolates the small group of funds where the overnight tape is doing real work versus the much larger group where it's incidental.
01The map nobody draws this way
For each of the 49 ETFs we built a six-feature behavioral fingerprint: overnight share of total dollar volume, intraday realized vol, the ratio of overnight gap vol to intraday return vol, average daily intraday range, directional consistency (does the overnight VWAP sit on the same side as the next session's open gap), and overnight gap vol itself. The features were standardized and fed into a K-means clustering with K=4. We dropped one trivial cluster of one — SGOV, an ultrashort Treasury fund with realized vol near 1% — and were left with three real groups.
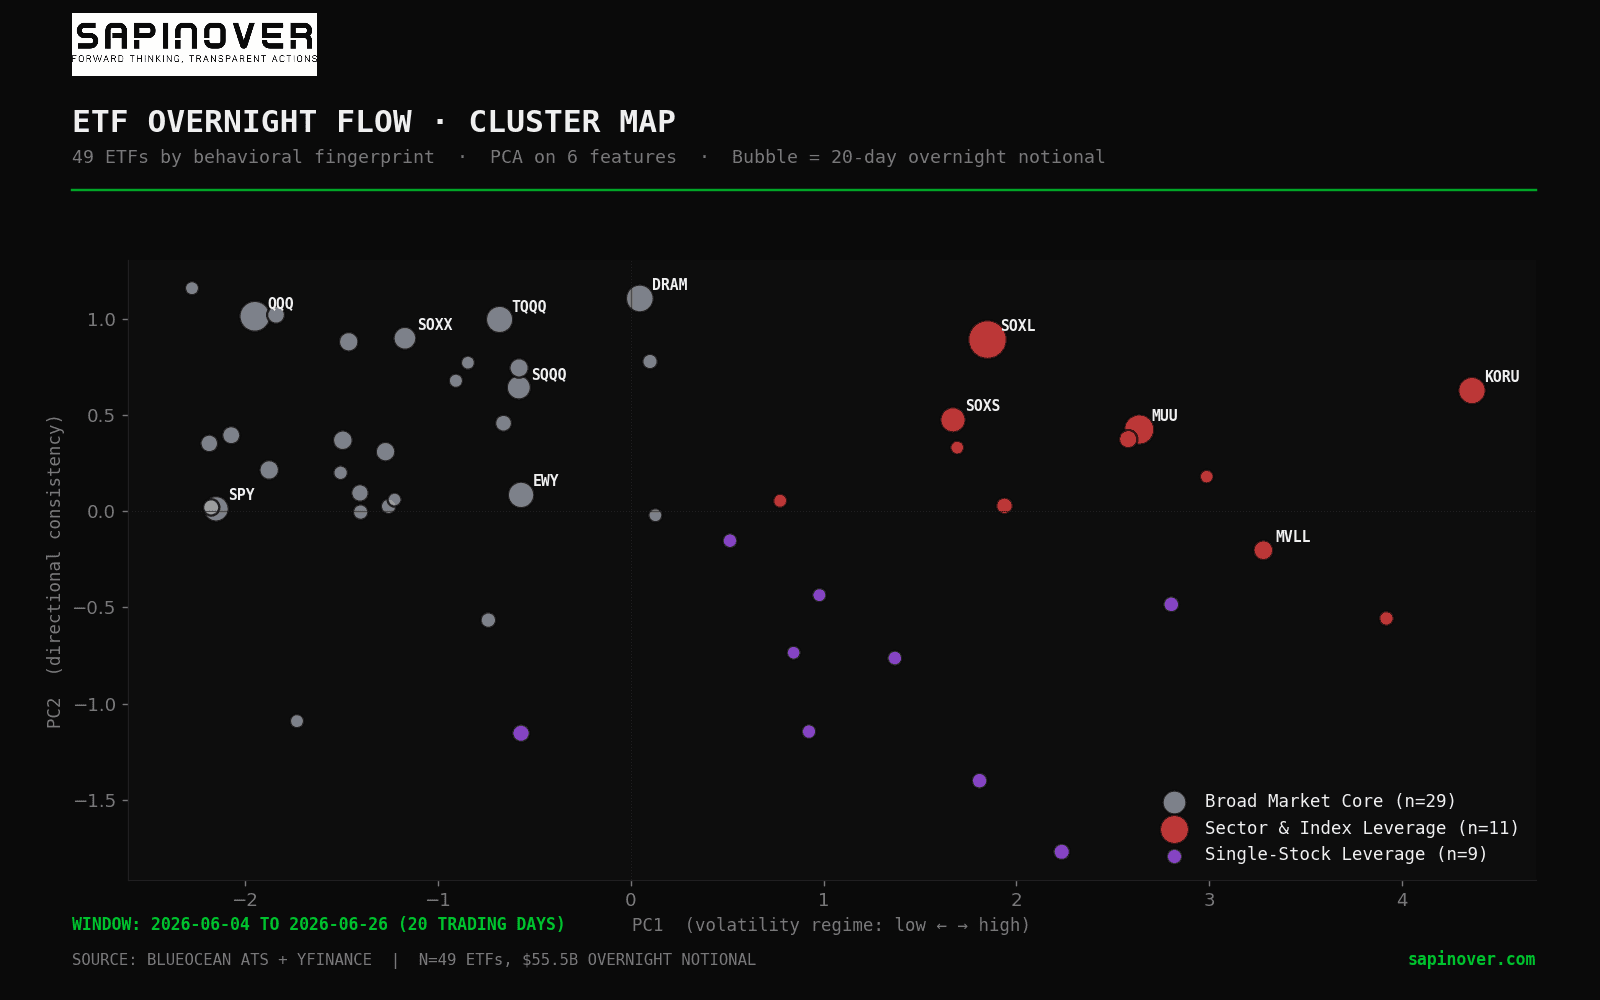
The map separates cleanly. The grey cluster on the left is the broad market: SPY, QQQ, IBIT, GLD, the index trackers and the mega-caps where the night session is a quiet extension of the day. Twenty-nine funds live here, total overnight notional twenty-seven billion dollars, and the average fund spends just 1.90% of its dollar volume on the overnight tape.
The red cluster on the right is sector and index leverage: SOXL, MUU, KORU, SOXS, MVLL, SNDU, TQQQ-class instruments where the underlying basket itself is volatile and the fund stacks two or three multiples on top. Eleven funds, total overnight notional nearly twenty-seven billion dollars. Roughly the same dollar tape as the broad-market group, generated by less than half as many funds. Average overnight share inside this cluster: 6.16%. Three times the broad-market rate.
The purple cluster at the bottom is single-stock leverage: NVDL, ASTX, AAOX, RKLX, LITX and their cousins. Nine funds, only $1.7B of overnight notional, but the most distinctive behavioral signature in the dataset. They sit low on PC2 because their directional consistency averages just 65% versus 85% for the other two groups. The overnight tape on a single-stock leveraged ETF is not a directional thesis the way the overnight tape on QQQ is. It's mostly noise and hedging.
02The convexity in plain sight
Plotting leverage factor against overnight share turns the relationship into a picture. The grey funds — the 1x ETFs — sit on the floor. Almost all of them park below 3% of their daily volume on the overnight tape. The leveraged funds form a column that rises off the floor at 2x and runs all the way to KORU at 15%.
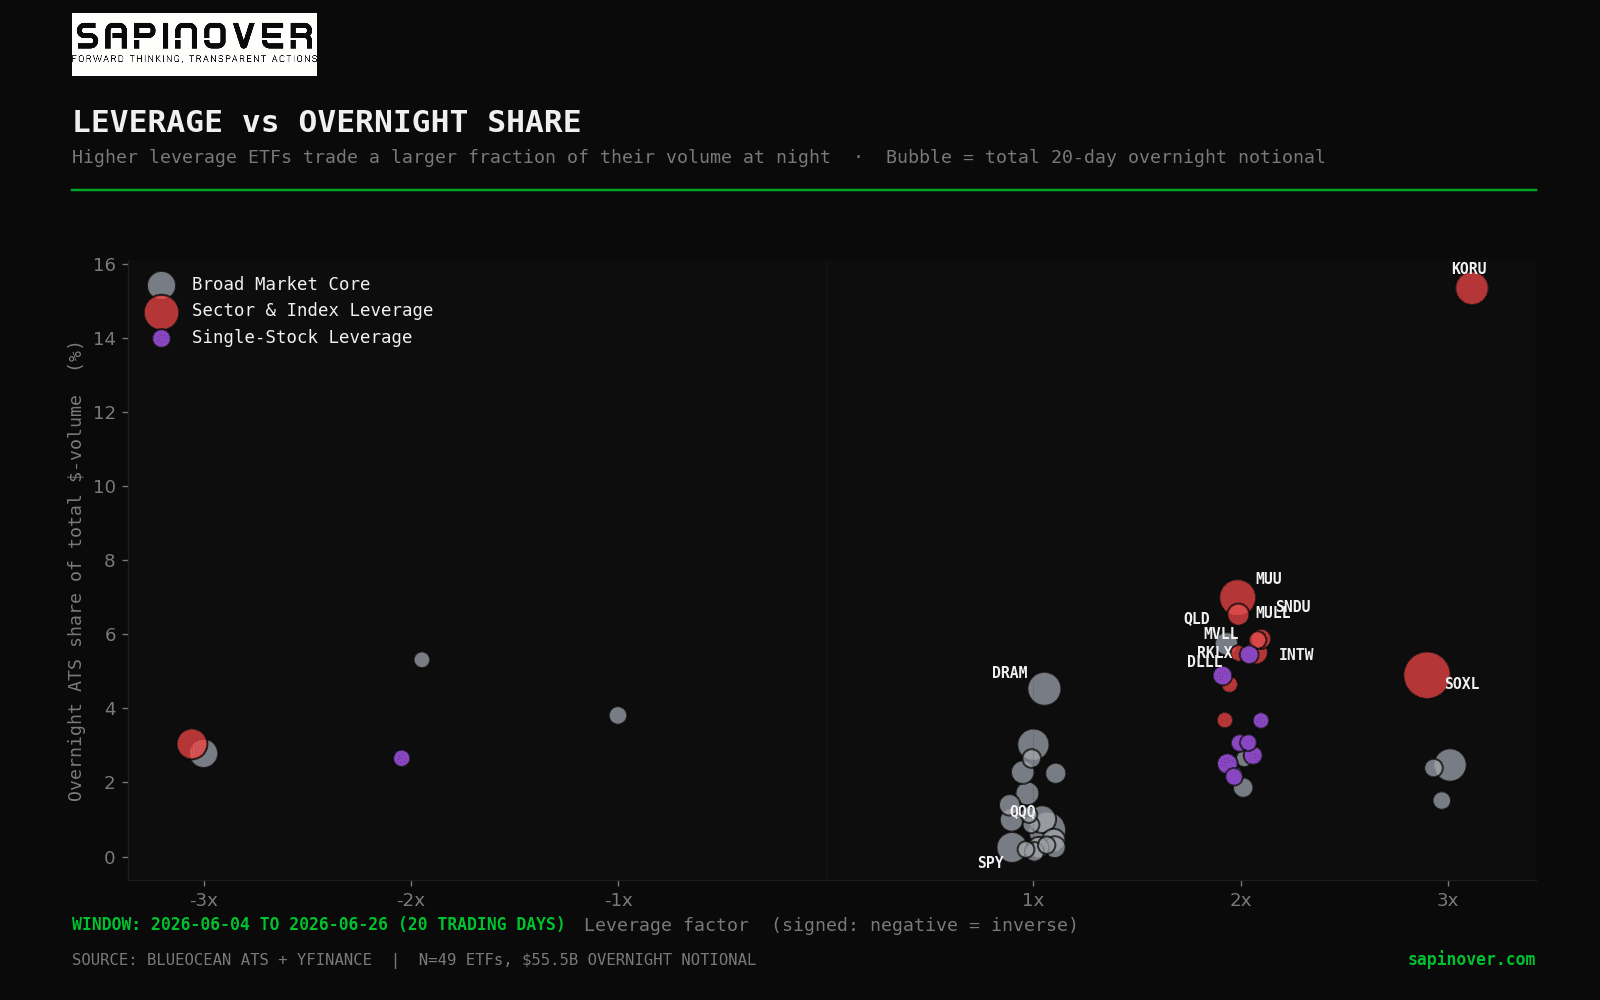
Across the whole sample, the leveraged funds (n=29) average a 4.31%overnight share against just 1.40% for the plain funds (n=20). That is a 3.07x multiple. The leverage label is doing real work on overnight behavior, not decorative work. The most extreme case, KORU, prints more than fifteen cents of every dollar of its volume in the dark window.
03The tape, side by side
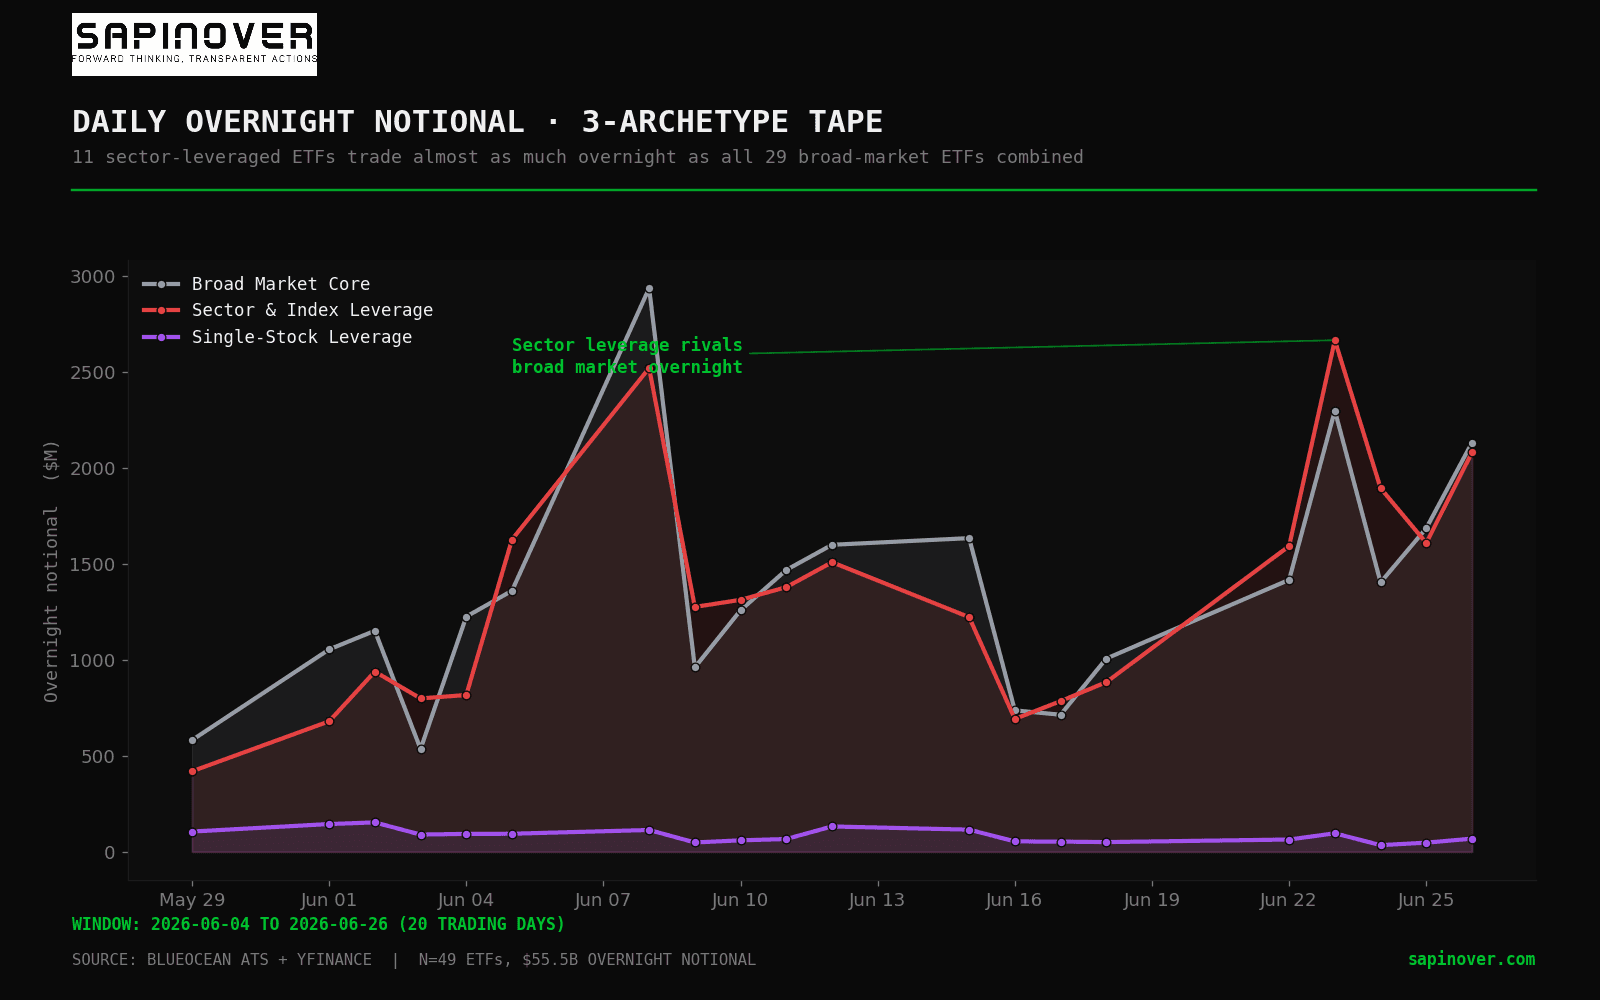
Day by day, the broad-market overnight tape and the sector-leverage overnight tape are nearly indistinguishable in dollar terms. Some sessions the broad market leads. Other sessions sector leverage does. Single-stock leverage runs flat along the floor.
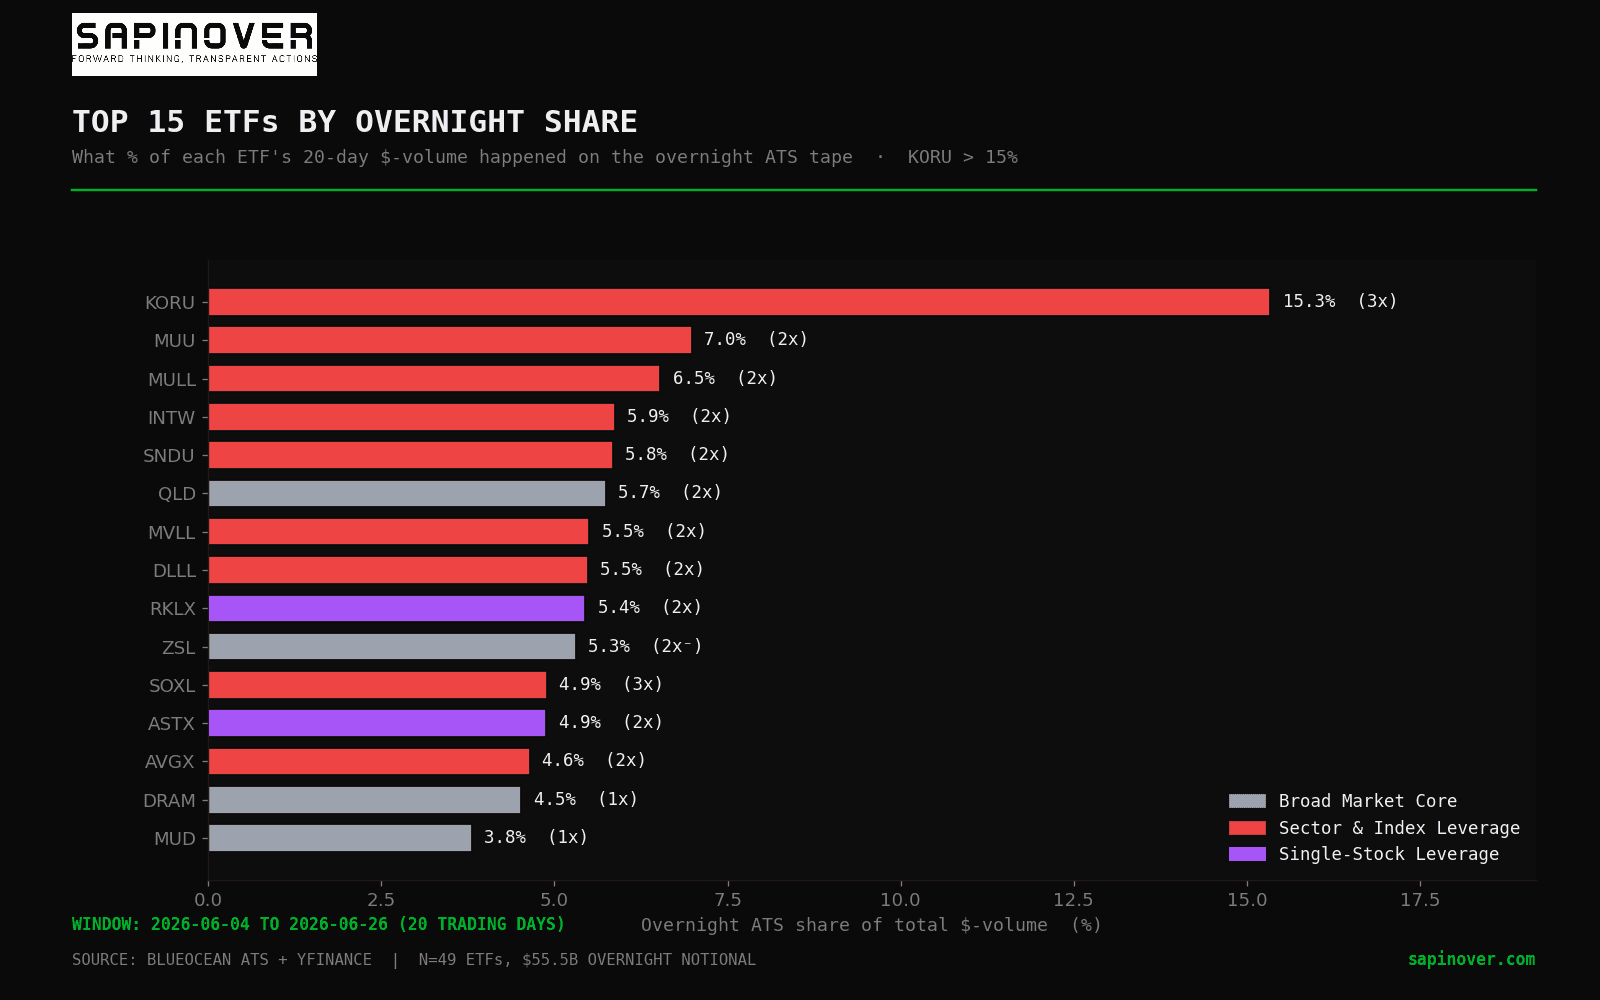
The concentration view sharpens the point. Eleven of the top fifteen ETFs by overnight share are leveraged. KORU sits more than twice above the next name. The first plain 1x ETF on the list is DRAM at 4.5%, and that's a thematic AI memory fund that behaves like a high-vol sector instrument in everything but its leverage label.
04What the night actually predicts
The headline finding is one we did not expect. For each archetype, we computed the rolling z-score of total overnight notional against a trailing baseline. Then we asked a simple question: does that z-score on night T predict the QQQ intraday range on day T+1? We split each archetype's z-scores into terciles and looked at the average next-day QQQ range in the bottom (cold) tercile versus the top (hot) tercile.
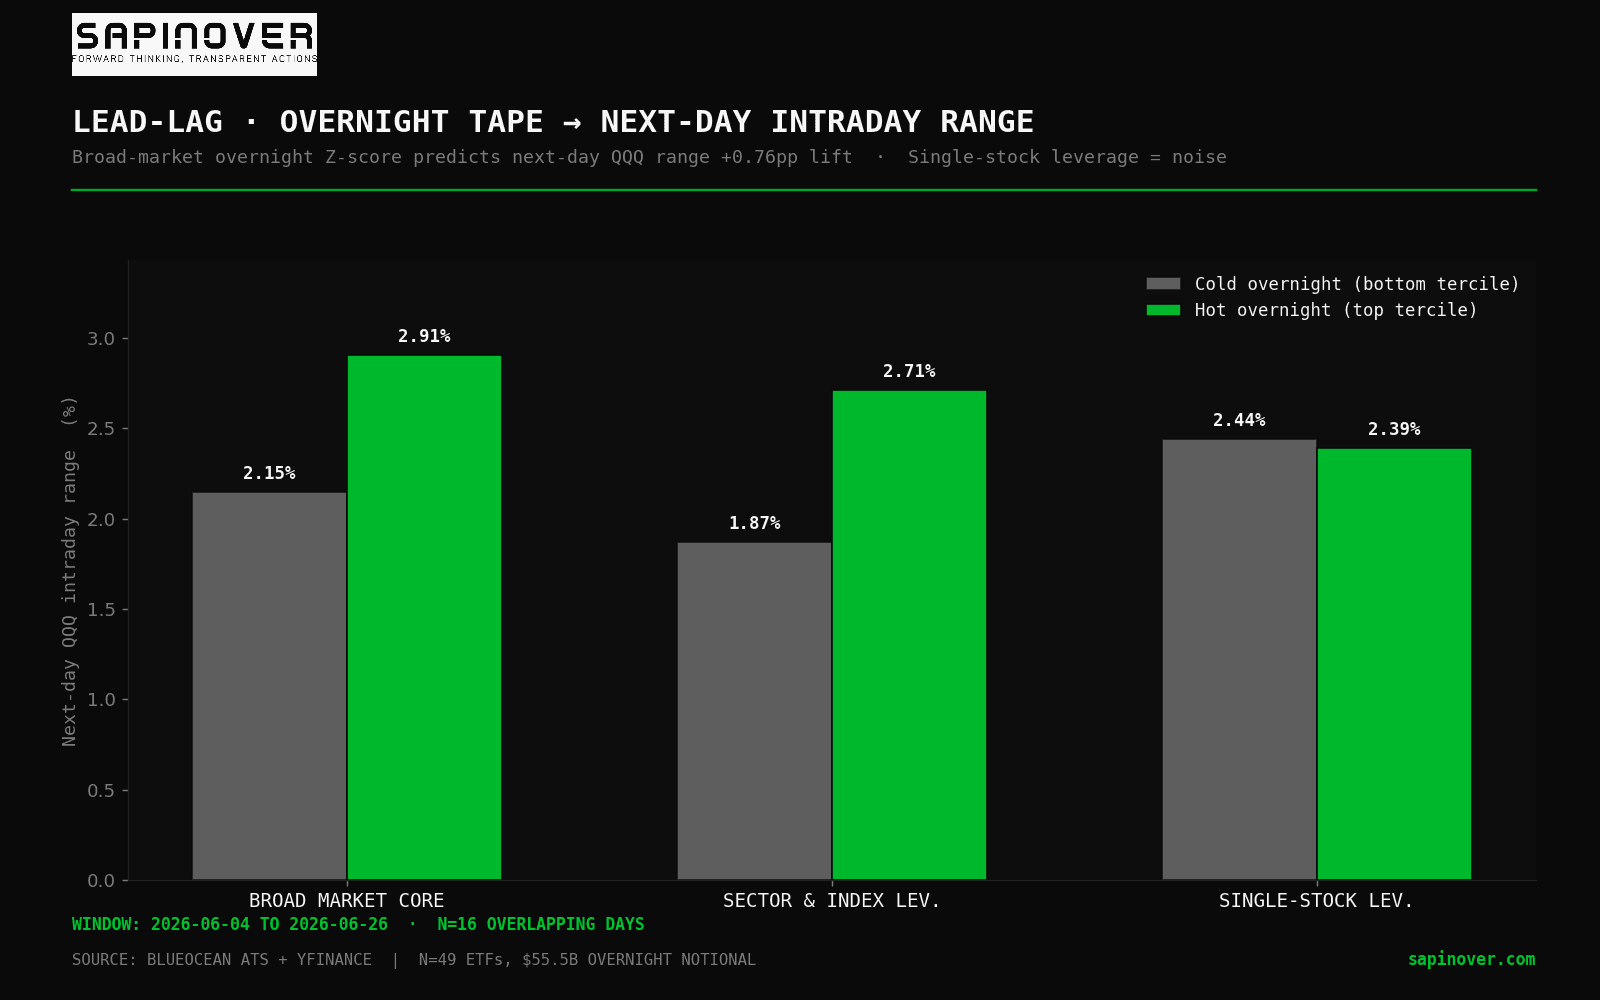
The broad-market group has the strongest signal. When the broad-market overnight tape runs hot, next-day QQQ range averages 2.91% against 2.15%on cold nights — a 76-basis-point lift. Sector and index leverage carries a similar lift on QQQ (2.71% vs 1.87%, +84 bps). Single-stock leverage is flat: 2.39% hot, 2.44% cold. The single-stock overnight tape contains essentially no predictive signal for index-level intraday vol.
That broad-market overnight flow leads better than leveraged flow is the kind of result that flips an intuition. The natural prior is that the leveraged tape, where the information density is highest per dollar, should be the canary. It isn't. The leveraged tape consumes volatility, but the broad-market tape generates the signal, because that's where macro repricing happens first. When SPY, QQQ, and IBIT themselves print at scale in the dark hours, the next session is going to range.
05The regime tape (HMM)
We fit a four-state Gaussian Hidden Markov Model on a daily five-feature vector covering the entire pipeline history: log total overnight notional, leveraged share, Herfindahl flow concentration, mean directional consistency, and average overnight gap magnitude. The HMM does not see prices or returns. It only sees the shape of the overnight tape itself. The states it learned are interpretable enough to label without torturing the data.
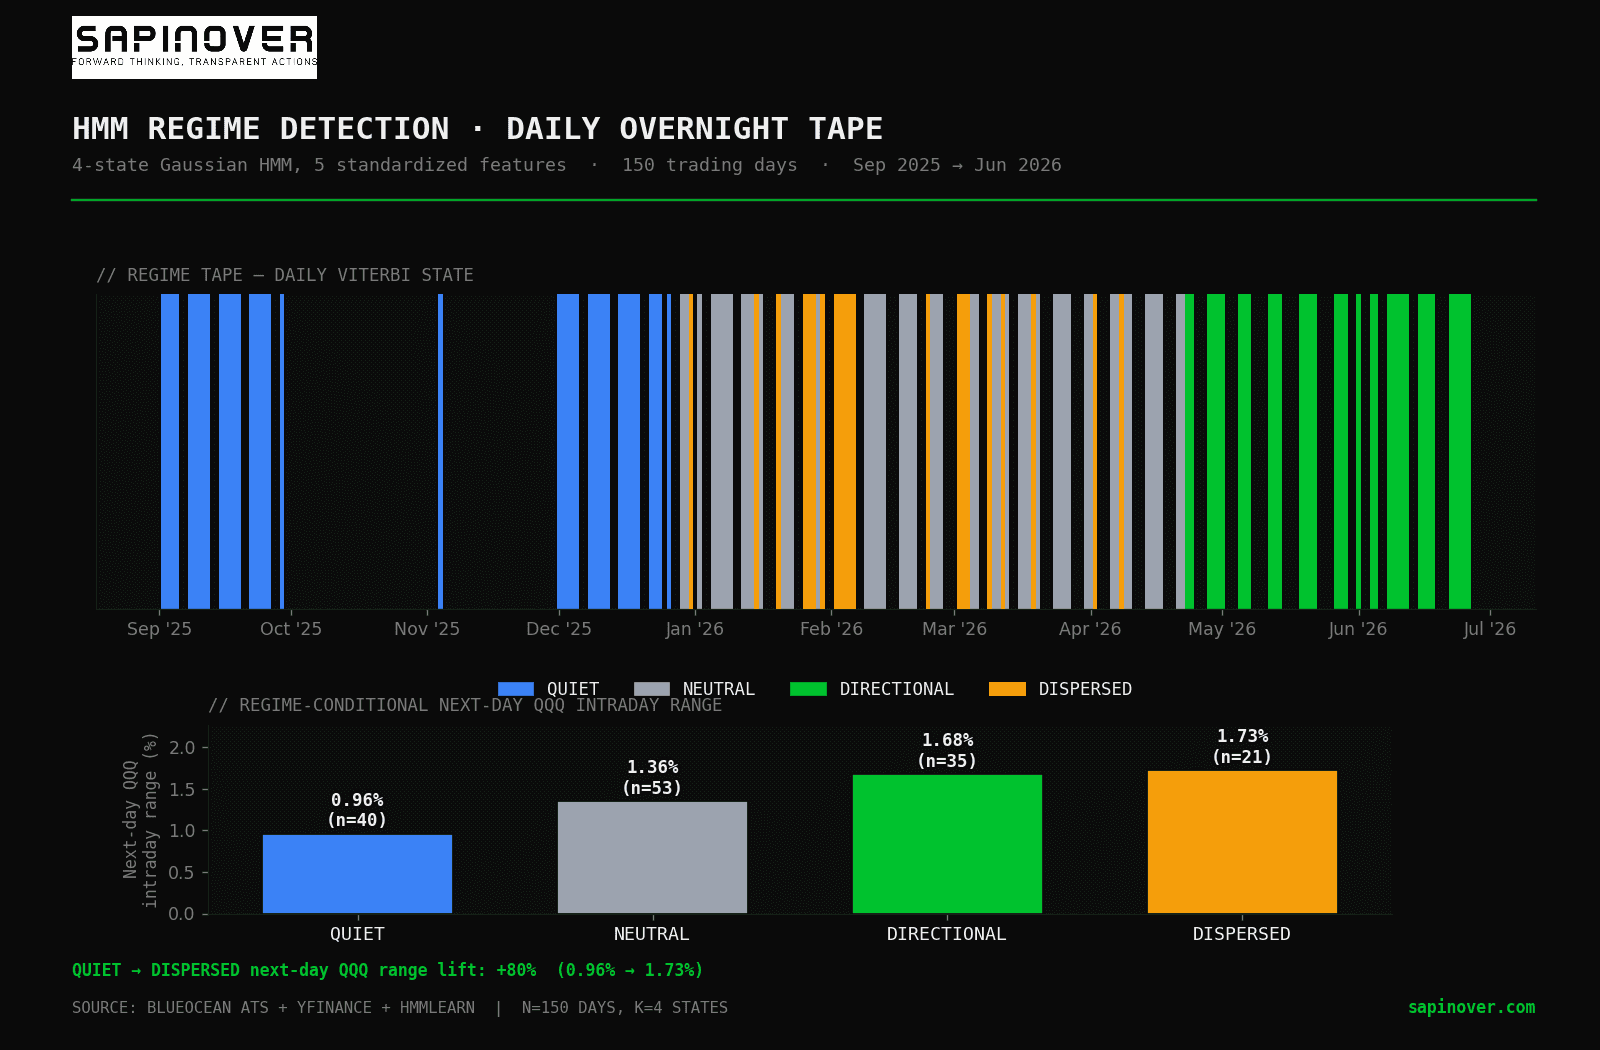
Four behavioral regimes emerged. QUIET nights (n=40) are the lowest total overnight notional, modest leveraged share, low gap magnitude. They dominated the early sample (September through early December 2025) when total overnight ETF volume was averaging $680M a night. NEUTRAL (n=53) is the modal state: middle-of-the-distribution flow, decent directional consistency, low gap dispersion. DIRECTIONAL (n=36) is high notional with high directional consistency — flow that pushes one way and keeps pushing. The market has been in this regime continuously since late May 2026. DISPERSED(n=21) is the rarest and most interesting: high notional but low directional consistency and high gap magnitude. These are the nights when nothing aligns and the tape is fighting itself.
The validation is the bottom panel. Each regime was fit without ever looking at the next session's QQQ range. When you then bucket the next-day QQQ ranges by which regime classified the prior night, the means separate cleanly: QUIET 0.96%, NEUTRAL 1.36%, DIRECTIONAL 1.68%, DISPERSED 1.73%. That is an 80% lift in next-day intraday range moving from the calmest regime to the most fragmented. The HMM did not get told what to look for. It found a thing that predicts a thing nobody told it about.
06What the model actually weighs (SHAP)
The HMM tells you what state of the night you're in. It doesn't tell you which underlying signals make next-day range move. For that we trained a small regularized XGBoost regressor to predict next-day QQQ intraday range from fourteen overnight features plus two market-context controls (VIX level, same-day QQQ range as an autoregressive baseline). 101 training days, 44 held-out test days chronologically forward. The model beat the naive AR-1 baseline by 16.8% on test MAE (0.597% vs 0.718%). The test R-squared is small but positive at 0.06. This is small-sample, single-asset, noisy-target territory and the honest read is that the predictor is modestly useful, not deployable. What it buys us is feature attribution.
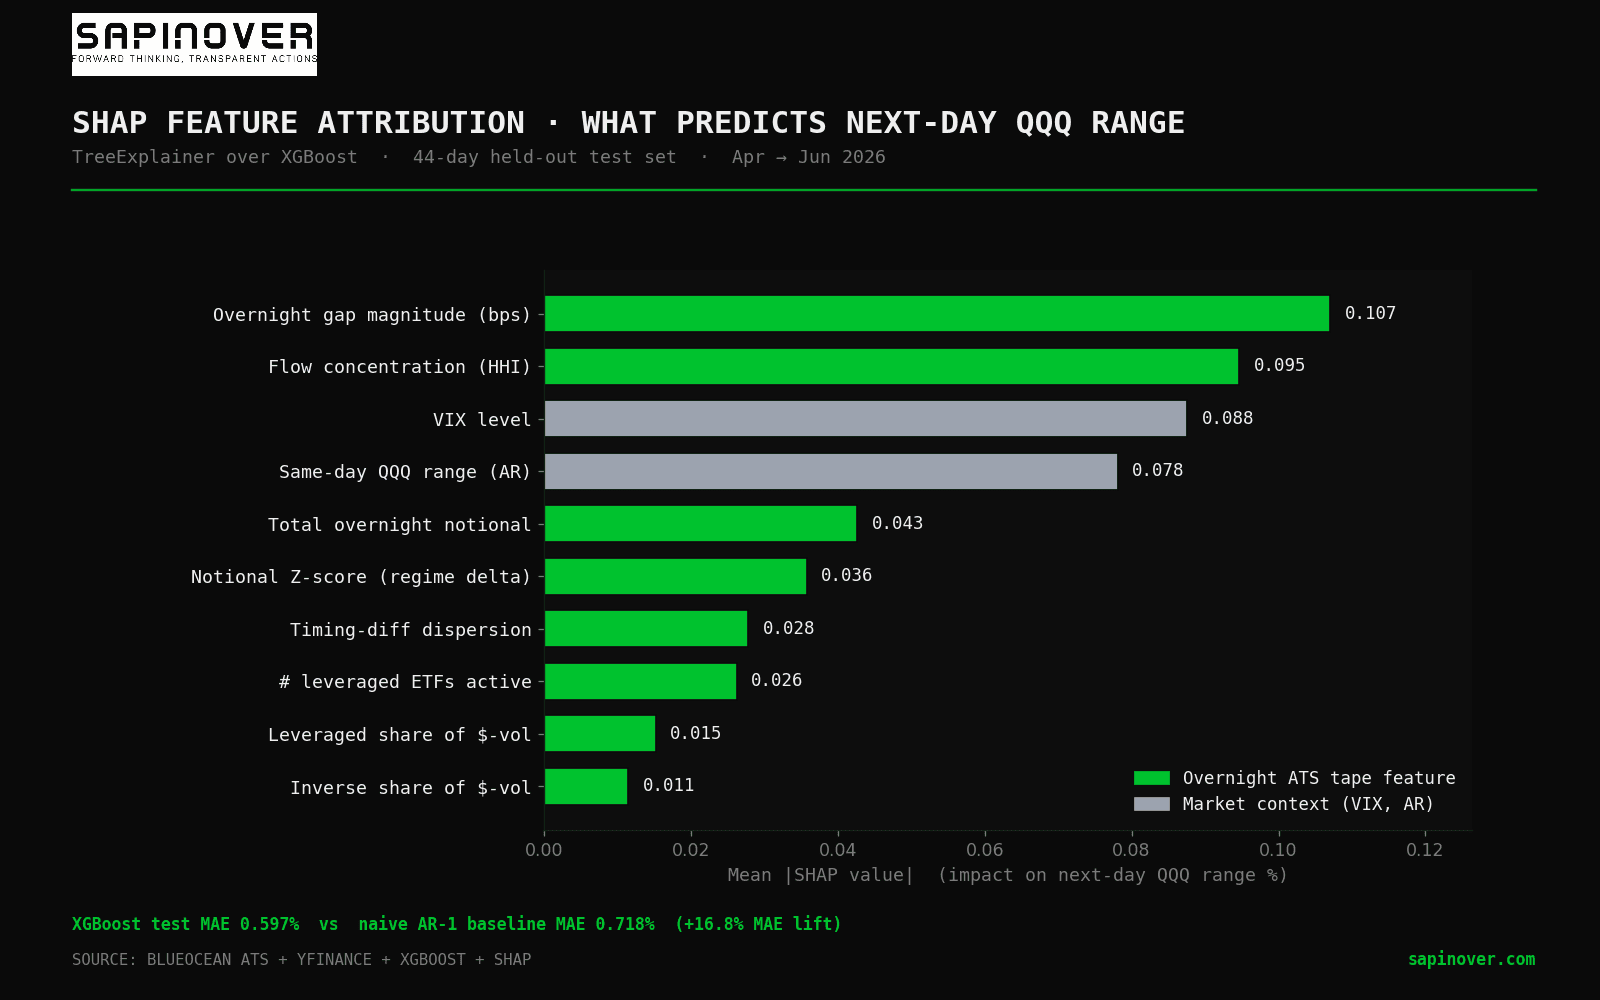
The top of the chart is the surprise. Overnight gap magnitude — the mean absolute basis-point gap between the overnight VWAP and the next session's open — is the most influential single feature. It beats VIX. It beats the same-day QQQ range autoregressive baseline. The model is telling us that the size of overnight repricing across the ETF universe carries more information about next-day intraday range than the size of intraday vol itself does.
Second comes flow concentration (Herfindahl). When the overnight tape is dominated by a few names, the next session ranges differently than when flow spreads across many. This is consistent with the cluster-map finding that single-stock leverage is local information — but here we see concentration itself, regardless of which names are involved, as a structural predictor.
Third and fourth — VIX level and same-day QQQ range — are the market-context controls. They matter, but they don't dominate. That is the validation: the two top features come from the overnight tape, not from the control set. The overnight tape carries genuine, non-redundant predictive content.
Most interesting is what sits at the bottom: leveraged share and inverse share, the headline numbers from the first half of this report. They are the smallest contributors in the SHAP attribution. The composition of the overnight tape (how much is leveraged) matters less than the geometry of it (how big are the gaps, how concentrated is the flow, what state of the regime is the market in). The headline is dramatic; the model finds it descriptive but not predictive.
07How to read this map going forward
The five takeaways are operational, not academic.
One. Leverage concentration is now a measurable, not theoretical, phenomenon in the overnight session. Eleven funds, $26.7B, indistinguishable in dollar magnitude from the entire broad-market overnight tape. A risk-aware overnight book treats the sector-leverage cluster as its own venue, not as an accent on the broad market.
Two. The broad-market overnight tape is a forward indicator for intraday range. When SPY, QQQ, and IBIT light up the dark hours, the next session ranges wider. The single-stock leverage tape, despite its volatility, does not generalize. It is local information about the underlying single name, not a macro signal.
Three. The directional consistency split — 85% for the broad and sector-leveraged groups, 65% for single-stock leverage — is a fingerprint we can use to classify any new fund that shows up in the top-50 overnight list. A new launch that runs at 65% directional consistency belongs in the single-stock cluster regardless of what its prospectus says, and should be modeled as a hedging or noise instrument, not a directional bet.
Four. There are four real states of the overnight tape, and they predict next-day intraday vol with an 80% range lift between the calmest and the most fragmented. The market has been in DIRECTIONAL regime continuously since late May 2026. The HMM is the cheapest way to know which state you woke up in.
Five. When you ask a model what predicts next-day intraday range, it picks gap magnitude and flow concentration over leveraged share. The composition of overnight flow is the story. The geometry of it is the signal.
// Methodology
Data window. 20 trading days, May 29 through June 26, 2026. Overnight ATS data from BlueOcean. Intraday OHLCV from yfinance, pulled at end of day for the 50 most-traded ETFs by 20-day overnight notional. ETF metadata (leverage factor, inverse flag, family, category) joined from Sapinover's internal etf_enriched dataset of 1,137 funds.
Feature engineering. Six standardized features per fund: overnight share of total dollar volume, annualized intraday realized vol, ratio of overnight gap vol to intraday return vol, average intraday range, directional consistency rate, and annualized overnight gap vol. Leverage factor itself was deliberately excluded from the clustering feature set to avoid trivial separation.
Model. K-means clustering with K=4, random_state=42, 20 initializations. PC1 explains 56% of variance; PC2 explains 21%. One trivial cluster (SGOV, n=1) was dropped before downstream analysis.
Lead-lag. For each archetype and each trading day, total overnight notional was z-scored against a 20-day trailing baseline. Z-scores were split into terciles and matched against the next session's QQQ and SPY intraday range and absolute open-to-close move. Sample size after baseline burn-in: 16 days.
HMM. Gaussian Hidden Markov Model via hmmlearn with K=4 latent states, diagonal covariance, fit on 150 trading days (Sept 2, 2025 through June 25, 2026, after dropping early dates with sparse ETF activity). Features: log total overnight notional, leveraged share, Herfindahl concentration, mean directional consistency, and average absolute overnight gap (bps). All five standardized before fitting. State labels were assigned by their centroid signatures (QUIET = lowest notional, DIRECTIONAL = highest mean directional consistency, DISPERSED = highest gap magnitude among remaining, NEUTRAL = residual). Validation: regime-conditional next-day QQQ intraday range was not used in training and separates by 80% (0.96% to 1.73%) across the four states.
SHAP. XGBoost regressor predicting next-day QQQ intraday range from 14 features (overnight tape: 12; market context: VIX level, same-day QQQ range as AR baseline). Chronological train/test split: 101 days train (Sep 2025 - Apr 7, 2026), 44 days test (Apr 8 - Jun 25, 2026). Hyperparameters tuned for small-sample regularization (max_depth=2, n_estimators=80, reg_alpha=0.5, reg_lambda=2.0). Naive AR-1 baseline (predict next-day range = today's range) MAE 0.718%; XGBoost test MAE 0.597%, improvement +16.8%. Test R-squared 0.06 — small but positive. SHAP values computed via TreeExplainer on the 44-day test set.
08Coming next — interactive
This is the static report. The interactive flow lab will let you watch tonight's HMM regime probability evolve in real time, see the SHAP attribution refresh as new features land, filter the cluster map by leverage tier, and click any individual fund to see its overnight fingerprint against its cluster centroid. The HMM regime panel alone is the daily check we're building it for: one glance and you know what state of the night you woke up in.
Until then: the static lab is the read. See the underlying overnight tape day-by-day on the Session Summary, or browse any of the 1,137 covered funds in the ETF directory.